| □ | The Income and Expense Chart report provides a Bar Chart and Legend of the Company's Income and Expense Totals by comparing the results of a selected range of Years spanning up to ten Years, or comparing a range of Months spanning up to five Years, and optionally with the reported limited to a selected Department or a selected Division, if desired. |
| • | To access the Income -vs- Expense report: from the Main Menu, Choose Reports and Select General Ledger where the list of General Ledger Reports will be displayed. |
| • | Choose the Financial Reports option to view the sub-menu and Select Income -vs- Expense. |
| □ | Income and Expense Chart tabs - There are three tabs on the Income and Expense Chart dialog. |
| • | Options - Initially only the Options tab is shown (until you make your Options selections and Select Print). |
| • | Period - Specify the Starting and Ending Date Range to be used for creating the Bar Chart. |
| • | Yearly - This is the default option. |
| ▪ | Click this button to graph the results for each Year within the Starting and Ending Date Range selected below. |
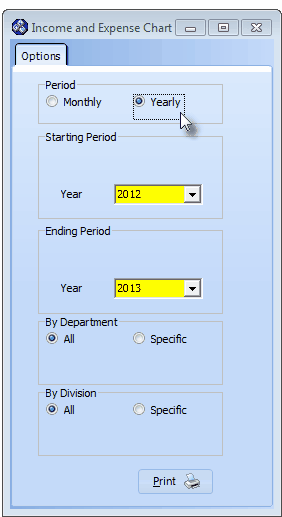
Income & Expense - Yearly option selected
| ▪ | Starting Period - Enter the Starting Period for this Yearly Income and Expense Chart. |
| o | Year - Use the Drop-Down Selection List to Choose the appropriate Starting Year. |
| ▪ | Ending Period - Enter the desired Ending Period for this Yearly Income and Expense Chart.. |
| o | Year - Use the Drop-Down Selection List to Choose the appropriate Ending Year for this Yearly Income and Expense Chart. |
| ◆ | A Date Range of up to Ten (10) Years may be charted. |
| • | Monthly - Click this button to graph the results for each Month within the Starting and Ending Date Range selected below. |
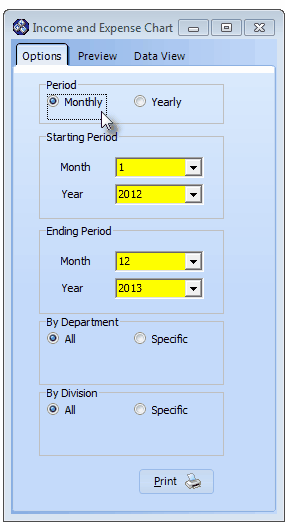
Income & Expense - Monthly option selected
| ▪ | Starting Period - Enter the Starting Period for this Monthly Income and Expense Chart. |
| o | Month - Use the Drop-Down Selection List to Choose the appropriate Starting Month. |
| o | Year - Use the Drop-Down Selection List to Choose the appropriate Starting Year. |
| ▪ | Ending Period - Enter the desired Ending Period for this Monthly Income and Expense Chart.. |
| o | Month - Use the Drop-Down Selection List to Choose the appropriate Ending Month. |
| o | Year - Use the Drop-Down Selection List to Choose the appropriate Ending Year for this Monthly Income and Expense Chart. |
| ◆ | A Date Range of up to Five (5) Years may be charted. |
| • | By Department - By default, all of the Company's Income and Expense Totals for All Departments will be included. |
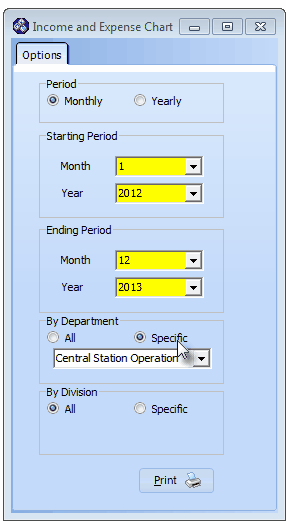
Income & Expense - Monthly option By Department
| ▪ | Specific - To limit this information to Income and Expense Totals for a specific Department, Click this button and use the Drop-Down Selection List provide the Choose the appropriate Department. |
| o | Right-Click within this Drop-Down Selection List field to Choose the desired Search By method (i.e., by Title or Department Number). |
| o | If the By Department option is selected, the By Division option is not available |
| • | By Division - By default, all of the Company's Income and Expense Totals for All Divisions will be included. |
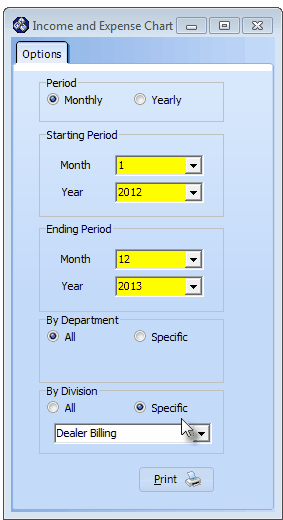
Income & Expense - Monthly option By Division
| ▪ | Specific - To limit this information to Income and Expense Totals for a specific Division, Click this button and use the Drop-Down Selection List provide the Choose the appropriate Division. |
| o | Right-Click within this Drop-Down Selection List field to Choose the desired Search By method (i.e., by Division Code or Name). |
| o | If the By Division option is selected, the By Department option is not available |
| • | Print - Click the Print button  to Preview and optionally Print this Income and Expense Chart. to Preview and optionally Print this Income and Expense Chart. |
| □ | The Preview tab presents the report which resulted from the Options you've selected. |
| • | Up Arrow/Down Arrow - hi - Not in use because this is a one page report (chart). |
| • | Page Up/Page Down - Not in use because this is a one page report (chart). |
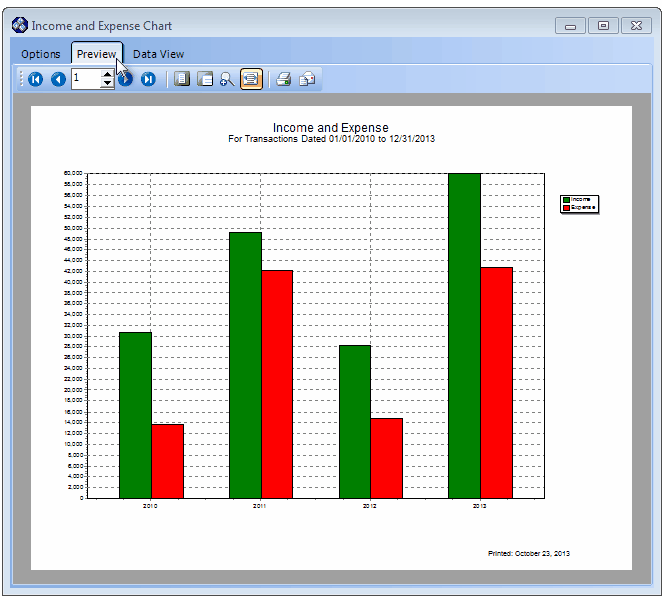
Income and Expense Chart - Preview tab displaying Yearly option results for 2010 - 2013
| • | Arrows - Not in use because this is a one page report (chart). |
| • | Number - Indicates the page number you are viewing. |
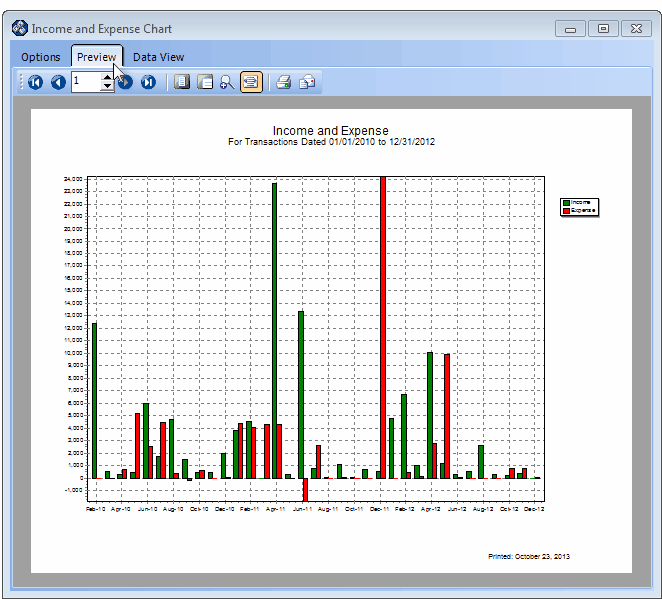
Income and Expense Chart - Preview tab displaying Monthly option results for 2010 - 2012
| • | Fit To Page - Click the first button after the arrows to size a full page of the report to fit the screen. |
| • | Zoom To 100% - Click the second button after the arrows to display the page at 100% (of the printed view). |
| • | Fit To Page Width - Click the third button after the arrows to size the page of the report to fit the full width of the screen. |
| • | Zoom To Percentage - Click the fourth button after the arrows to re-size the page of the report by percentage. |

| • | When you Click the Zoom To Percentage button, the Percentage selector will be displayed. |
| • | You may then Click the Up or Down ‚ arrows to set the exact amount of Zoom you want. |
| • | Print - Click the Print button  to Print the displayed Income and Expense Chart. to Print the displayed Income and Expense Chart. |
| • | Email - Click the Email button  to send the Report to an Email Address of your choosing. to send the Report to an Email Address of your choosing. |
| • | To Exit the Preview tab and Close this Report dialog Form, Click the Close button x on the right at the top of the Preview tab. |
| □ | Data View - This view provides a tabular (spreadsheet style) presentation of the selected Income and Expense Chart data. |
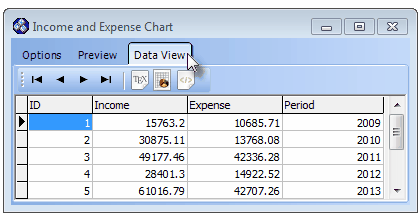
Income and Expense Chart - Report - Data View tab
| • | Arrows - Click the arrows to move through the records. |
| • | Export - Exporting the data from this Data View Form (note the "fly-over" help available on these buttons): |
| • | Export to CSV - Click the first button after the arrows to export the data to a Comma Separated Values (CSV) file format. |
| • | Export To Excel - Click the second button after the arrows to export the data to an Excel (.xls) file format. |
| • | Export To Html - Click the third button after the arrows to export the data to an HTML formatted file. |
| • | To Exit the Data View tab and Close this Report dialog Form, Click the Close button x on the right at the top of the Data View tab. |

