| □ | The Net Worth report provides a Bar Graph and Legend of the Assets and Liabilities for a selected Date Range and graphs the Company's Net Worth (the Value of the difference between those Assets and Liabilities - Assets minus Liabilities = Net Worth) for each reported month. |
| • | To access the Net Worth report: from the Main Menu, Choose Reports and Select General Ledger where the list of General Ledger Reports will be displayed. |
| • | Choose the Financial Reports option to view the sub-menu and Select Net Worth. |
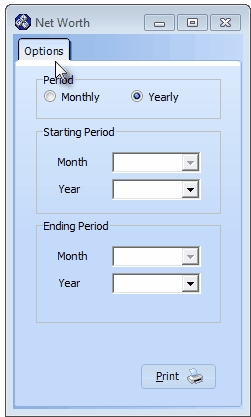
Net Worth - Options tab
| □ | Net Worth tabs - There are three tabs on the Net Worth dialog. |
| • | Options - Initially only the Options tab is shown (until you make your Options selections and Select Print). |
| • | Period - Specify the time period to be used for creating the Bar Chart. |
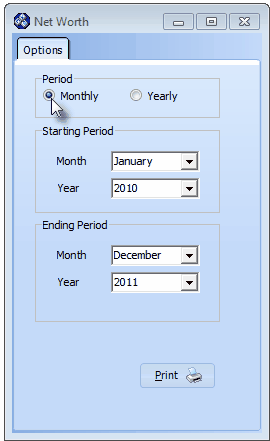
Monthly option selected
| • | Monthly - Click this button to graph the results for each Month within the Starting and Ending Date Range selected below. |
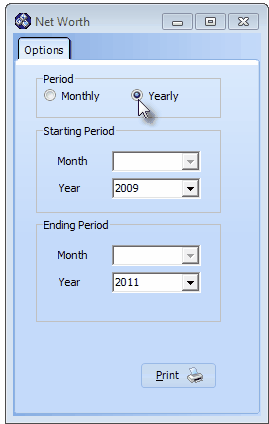
Yearly option selected
| • | Yearly - Click this button to graph the results for each Year within the Starting and Ending Date Range selected below. |
| • | Starting Period - Depending on whether Monthly or Yearly was selected above, enter the desired Starting Period information. |
| • | Month - If Monthly was selected above, use the Drop-Down Selection List to Choose the appropriate Starting Month. |
| • | Year - You must enter a Starting Year. |
| ▪ | Use the Drop-Down Selection List to Choose the appropriate Starting Year. |
| • | Ending Period - Depending on whether Monthly or Yearly was selected above, enter the desired Ending Period information. |
| • | Month - If Monthly was selected above, use the Drop-Down Selection List to Choose the appropriate Ending Month. |
| • | Year - You must enter an Ending Year. |
| ▪ | Use the Drop-Down Selection List to Choose the appropriate Ending Year. |
| • | Print - Click the Print button  to Preview and optionally Print this Net Worth Chart. to Preview and optionally Print this Net Worth Chart. |
| □ | The Preview tab presents the report which resulted from the Options you've selected. |
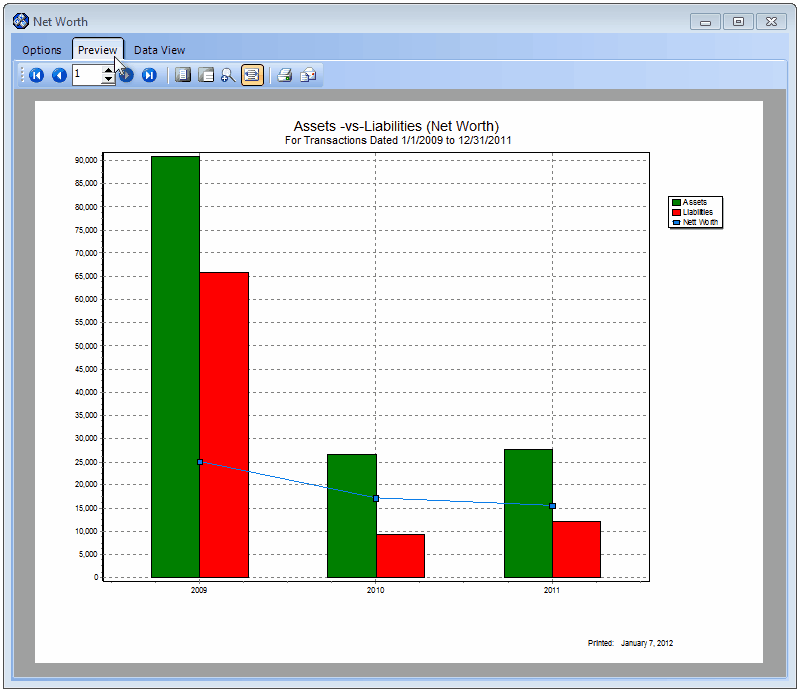
Net Worth - Preview tab with Yearly results for 2009 through 2011
| • | Up Arrow/Down Arrow - hi - Not in use. |
| • | Page Up/Page Down - Not in use. |
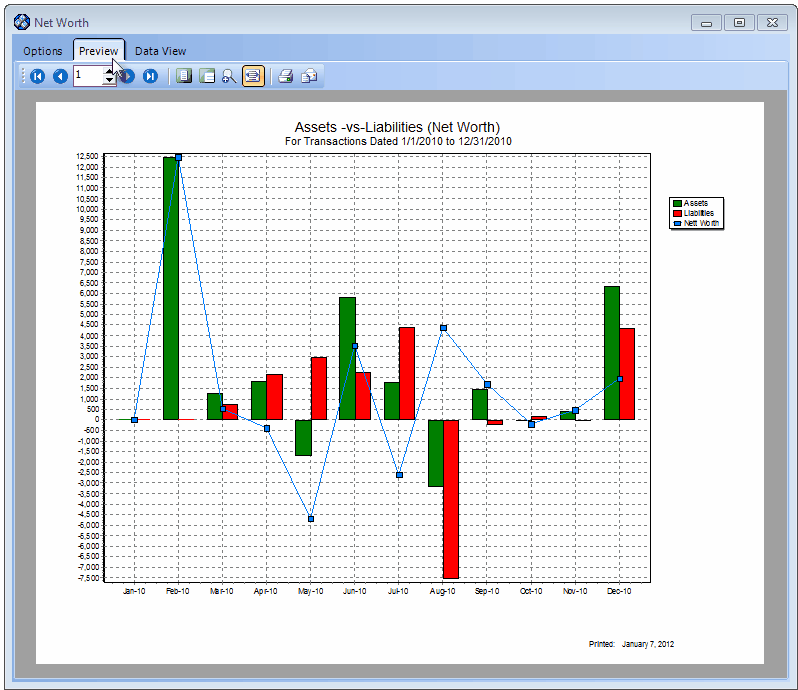
Net Worth - Preview tab with Monthly results for 2010
| • | Number - Indicates the page number you are viewing. |
| • | Fit To Page - Click the first button after the arrows to size a full page of the report to fit the screen. |
| • | Zoom To 100% - Click the second button after the arrows to display the page at 100% (of the printed view). |
| • | Fit To Page Width - Click the third button after the arrows to size the page of the report to fit the full width of the screen. |
| • | Zoom To Percentage - Click the fourth button after the arrows to re-size the page of the report by percentage. |

| • | When you Click the Zoom To Percentage button, the Percentage selector will be displayed. |
| • | You may then Click the Up or Down ‚ arrows to set the exact amount of Zoom you want. |
| • | Print - Click the Print button  to Print the displayed Net Worth Chart. to Print the displayed Net Worth Chart. |
| • | Email - Click the Email button  to send the Report to an Email Address of your choosing. to send the Report to an Email Address of your choosing. |
| • | To Exit the Preview tab and Close this Report dialog Form, Click the Close button x on the right at the top of the Preview tab. |
| □ | Data View - This view provides a tabular (spreadsheet style) presentation of the selected Net Worth data. |
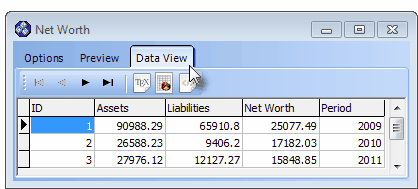
Net Worth - Data View tab
| • | Arrows - Click the arrows to move through the record. |
| • | Export - Exporting the data from this Data View Form (note the "fly-over" help available on these buttons): |
| • | Export to CSV - Click the first button after the arrows to export the data to a Comma Separated Values (CSV) file format. |
| • | Export To Excel - Click the second button after the arrows to export the data to an Excel (.xls) file format. |
| • | Export To Html - Click the third button after the arrows to export the data to an HTML formatted file. |
| • | To Exit the Data View tab and Close this Report dialog Form, Click the Close button x on the right at the top of the Data View tab. |

