| □ | The Chart of Accounts History report lists the closing Account Balance, and the Percentage Change from the previous year, for General Ledger Accounts (for a maximum of 5 years), starting with a selected Year - with the ability to choose a specific Month within that Year - and then looking back from there - calculating either a Year over Year, or a Month over Month comparison. |
| • | To access the Chart of Accounts History report: from the Main Menu, Choose Reports and Select General Ledger where the list of General Ledger Reports will be displayed. |
| • | Choose the Financial Reports option to view the sub-menu and Select Chart of Accounts History. |
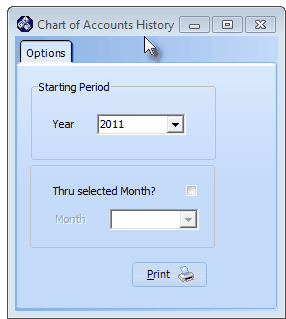
Chart of Accounts History - Options tab
| □ | Chart of Accounts History tabs - There are three tabs on the Chart of Accounts History dialog. |
| • | Options - Initially only the Options tab is shown (until you make your Options selections and Select Print). |
| • | Starting Period - Define which time period is to be reported: |
| • | Year - By default, the Current Year will be displayed. |
| ▪ | Use the Drop-Down Selection List to Choose a different Year, if appropriate. |
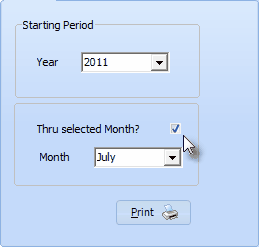
| • | Thru selected Month? - Check this box to identify a specific Month (within the Year selected above) on which to have this Chart of Accounts History report's data end. |
Starting Period Year -Thru a Selected Month
| ▪ | This options allows you to create a Year-To-Date report up to any Month within any Year that you have sufficient General Ledger System data recorded. |
| • | Month - Use the Drop-Down Selection List to Choose the desired Month. |
| • | Print - Click the Print button  to Preview and optionally Print this Chart of Accounts History report. to Preview and optionally Print this Chart of Accounts History report. |
| □ | The Preview tab presents the report which resulted from the Options you've selected. |
| • | Up Arrow/Down Arrow - hi - Moves the report one line up, or one line line down, respectively. |
| • | Page Up/Page Down - Moves the report to the previous or next page, respectively. |
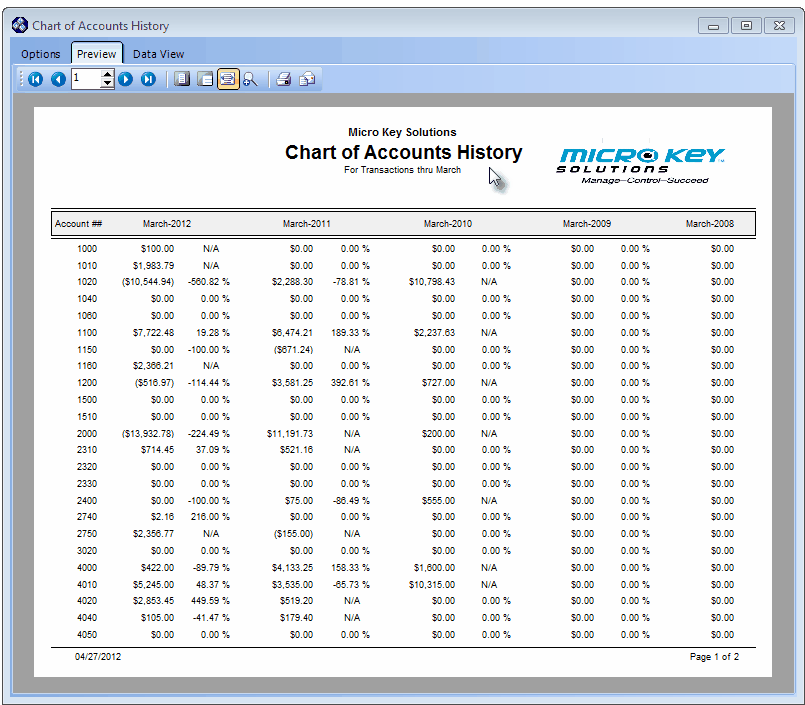
Chart of Accounts History Report - Preview tab
| • | Arrows - The arrows allow you to move back and forth, from page to page. |
| • | Number - Indicates the page number you are viewing. |
| • | You may also type in a specific page number, Press 8 Enter and that page will be displayed immediately. |
| • | If you enter an invalid page number, it will be ignored. |
| • | Fit To Page - Click the first button after the arrows to size a full page of the report to fit the screen. |
| • | Zoom To 100% - Click the second button after the arrows to display the page at 100% (of the printed view). |
| • | Fit To Page Width - Click the third button after the arrows to size the page of the report to fit the full width of the screen. |
| • | Zoom To Percentage - Click the fourth button after the arrows to re-size the page of the report by percentage. |

| • | When you Click the Zoom To Percentage button, the Percentage selector will be displayed. |
| • | You may then Click the Up or Down ‚ arrows to set the exact amount of Zoom you want. |
| • | Print -Click the Print button  to Print the displayed Chart of Accounts History report. to Print the displayed Chart of Accounts History report. |
| • | Email - Click the Email button  to send the Report to an Email Address of your choosing. to send the Report to an Email Address of your choosing. |
| • | To Exit the Preview tab and Close this Report dialog Form, Click the Close button x on the right at the top of the Preview tab. |
| □ | Data View - This view provides a tabular (spreadsheet style) presentation of the selected Chart of Accounts History data. |
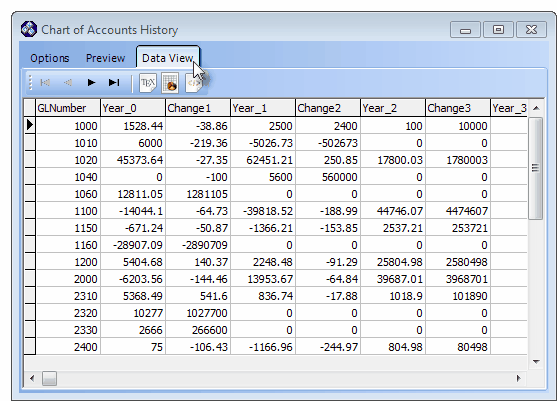
Chart of Accounts History Report - Data View tab
| • | Arrows - Click the arrows to move through the record. |
| • | Export - Exporting the data from this Data View Form (note the "fly-over" help available on these buttons): |
| • | Export to CSV - Click the first button after the arrows to export the data to a Comma Separated Values (CSV) file format. |
| • | Export To Excel - Click the second button after the arrows to export the data to an Excel (.xls) file format. |
| • | Export To Html - Click the third button after the arrows to export the data to an HTML formatted file. |
| • | To Exit the Data View tab and Close this Report dialog Form, Click the Close button x on the right at the top of the Data View tab. |

